The prior post reviewed lower estimate lots at the 2017 Arizona collector car auctions, which built on the post reviewing the performance of the auction companies Bonhams, Gooding & Company, and RM Sotheby’s. This post looks at the cars in the higher estimate group from those three auctions. A car is assigned to the higher estimate group if the mid-estimate (the average of the pre-auction low estimate and high estimate) was at least $250,000. To further help with the evaluation of the strength of the bidding and the accuracy of the pre-auction estimates, the lots are classified by the condition of the car. I did the classification and used the definitions in the Hagerty Price Guide - with an added condition (#5) for non-running basket-case cars. In this higher estimate group, there were no condition #5 category cars and only one condition #4 category car. Condition #3 category cars numbered 37 examples across the three auctions - while #2 category cars and #1 category cars totaled 62 and 10, respectively. Only cars that were sold are included and all prices are before fees.
The scatter plot below shows results for the three auction companies for the higher estimate group. Each auction company and condition group can be plotted separately, and by moving the cursor over each point, the lot, auction, mid-estimate, and sale price can be seen. A single lot can be highlighted after selecting one of the three auctions in the drop-down menu, and then typing the lot number into the text box. Regression equations and trend lines can be plotted too by checking the box. Selecting ‘All’ auctions will perform the regression on the condition group(s) for all three auctions combined (where there is sufficient data), while the other menu options do not combine results for the regressions. The prices are before buyer’s fees.
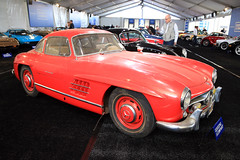
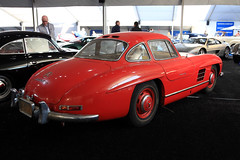
The only condition #4 category car was a single-family owner 1955 Mercedes-Benz 300 SL Gullwing. Offered by Gooding & Company, lot 18, had a pre-auction mid-estimate of $1,000,000 and sold for $1,325,000. While the condition of the car may have made it hard to accurately value before the auction, the single-family ownership provenance may have encouraged strong bidding too.
The three auction companies had more cars in the condition #3 category group, which resulted in the following regression equation:
$price = $7860 + 0.76 x $mid-estimate
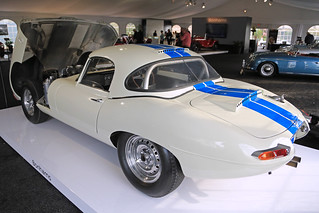
The 0.76 regression coefficient (the beta) suggests that buyers paid 76 percent (before fees) of the pre-auction mid-estimate plus $7,860 (the alpha) for cars in this condition group. The r2 of the regression was a high 0.99, which means that the mid-estimate explains 99 percent of the variance in the price. This high r2 number may be due to three cars sold at the Bonhams auction. Lot 24 was the 1963 Jaguar E-type Lightweight Competition, which had a pre-auction mid-estimate of $8,250,000 and sold for $6,700,000 (all prices are before fees).

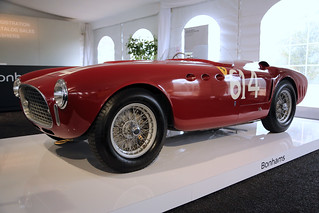
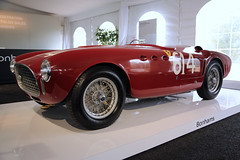
Lot 44 was the 1952 Ferrari 340 America Spider Competizione s/n 0196A by Vignale, which had a pre-auction mid-estimate of $8,250,000 and sold for $5,800,000.
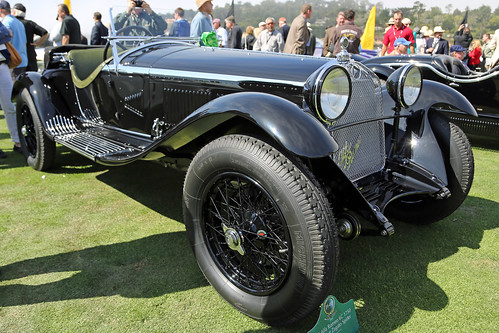
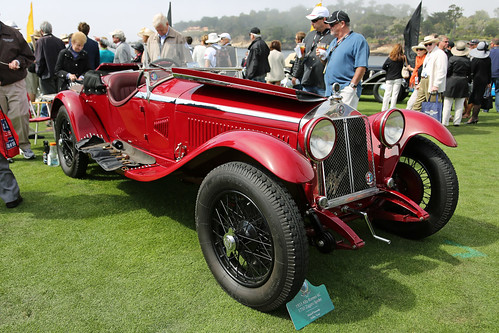
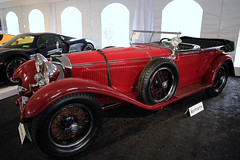
Lot 30 was the 1931 Alfa Romeo 6C 1750 5th Series Supercharged Gran Sport Spider by Zagato, which had a pre-auction mid-estimate of $3,100,000 and sold for $2,550,000.

The condition #2 category cars were the most numerous of the higher estimate group with 62 cars sold across the three auctions. The regression equation for the category is the following:
$price = -$6224 + 0.84 x $mid-estimate
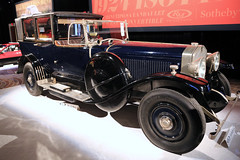
The 0.84 regression coefficient (the beta) suggests that buyers paid 84 percent (before fees) of the pre-auction mid-estimate, and as such were comfortable paying close to the pre-auction mid-estimate for a car in this condition #2 category. In contrast to the regression of condition #3 category cars, the intercept (the alpha) is a negative $6224, which means that after taking into consideration the pre-auction mid-estimate, cars in the condition #2 category were generally discounted by this amount. The r2 of the regression was a slightly lower 0.95, which means that the mid-estimate explains 95 percent of the variance in the price. One car that seems to have played a big part in the regression was auctioned by Bonhams. Lot 54 was the 1928 Mercedes-Benz Type S 26/120/180 Supercharged Sports Tourer Erdmann & Rossi, which had a pre-auction mid-estimate of $5,500,000 and sold for $4,375,000 (all prices are before fees).

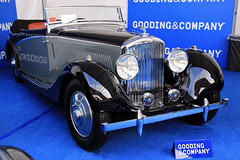
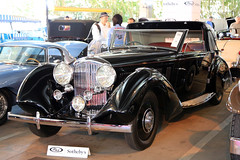
Lot 28 at Gooding & Company was the 1936 Bentley 4 1/4 Litre Cabriolet Antem, which had a pre-auction mid-estimate of $600,000 and sold for $320,000.
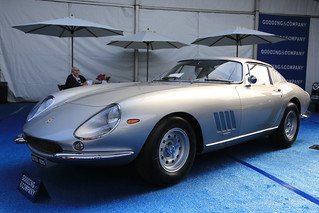
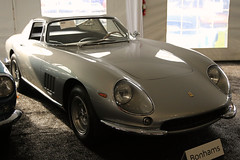
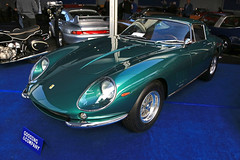
with pre-auction mid-estimate of $362,500 but only a high bid of $270,000 – perhaps the markets for Ferrari 275 GTBs and 1930s Bentleys are changing.
There were fewer best-in-the-world condition #1 category cars in the higher estimate group than in the lower estimate group, at 10 and 15, respectively. With few observations available, the r2 was 1.0, meaning that the mid-estimate of the cars in this category explained 100 percent of the variance in the sale price. With so few cars and apparently little disagreement about the value of those cars, the errors for lots in the condition #1 category regression tend to offset each other. The regression equation for the category is the following:
$price = $20 731 + 0.76 x $mid-estimate
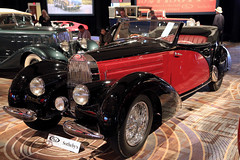
In terms of scooping up a good deal and or an example of a car with an optimistic pre-auction estimate, RM Sotheby’s lot 134, a 1939 Bugatti T57 Cabriolet by Letourneur et Marchand had a pre-auction mid-estimate of $1,375,000 and sold for $925,000.
Disclaimer
JohnWileyCars provides no warranty about the content or accuracy of the content published here. JohnWileyCars shall not be liable for any loss of profit or any other damages resulting from the use of the information published here.